
Keyword
Countries | Australia
164 record(s)
Type of resources
Topics
Keywords
Contact for the resource
Provided by
Formats
Update frequencies
Status
draft
-
This dataset contains data collected by the Australian Continuous Plankton Recorder (AusCPR) survey and is funded by IMOS (Ships of Opportunity sub-facility) and CSIRO. The aims of the AusCPR survey are to: * map plankton biodiversity and distribution * develop the first long-term plankton baseline for Australian waters * document plankton changes in response to climate change * provide indices for fisheries management * detect harmful algal blooms * validate satellite remote sensing * initialise and test ecosystem models. The survey conducts repeat tows in the GBR, the East Australian Current and down to the Southern Ocean Time Series Mooring (SOTS). Other routes are conducted on an adhoc nature around Australia. The dataset also contains phytoplankton data from the UTAS / AAD led Southern Ocean CPR (SOCPR) project which is also funded by IMOS. The datasets available in this collection include Phytoplankton Colour Index (an estimate of chlorophyll in the water), phytoplankton abundance, zooplankton abundance and a biomass index from AusCPR and phytoplankton abundance from SOCPR. This data are freely available through the AODN portal: https://portal.aodn.org.au. This data is freely available but please acknowledge all relevant parties, as detailed in acknowledgement section.
-
This record contains data collected from the near-water surface sampling site off the Lucinda Jetty, as part of the Lucinda Jetty Coastal Observatory. Sample collection began the 9th of January, 2014. The data can be used for Ocean Colour sensor validation. Parameters measured include the absorption coefficients of the particulate and dissolved components of the water column and the phytoplankton pigment concentration and composition.
-
This dataset comprises the phytoplankton abundance and biovolume estimates as part of a broader sampling program carried out at the Southern Ocean Time Series, a facility within the Integrated Marine Observing System (IMOS). The primary focus is sustained observing of ocean properties and processes important to climate, carbon cycling, and ocean productivity. Regular phytoplankton samples are collected at approximately 14 day intervals (exact intervals and seasonal coverage dependent on deployment length). The moorings are serviced annually, at which time the existing moorings are recovered and new moorings are deployed. Water samples from within the surface mixed-layer are collected at pre-programmed intervals using a Remote Access Sampler, in pairs about 1 hour apart. One sample in each pair is preserved for phytoplankton community composition by microscopy, and the other sample is preserved and used for accompanying chemical analysis of nutrients, total dissolved inorganic carbon (DIC) and alkalinity. Each sample is collected from within the surface mixed-layer at 32 m depth (2010 - 2017) or 5 m depth (2018-current) depending on the design of the mooring surface assembly and instrumentation. Typically a maximum of 24 samples are collected over an annual deployment cycle. The samples collected are analysed for: 1. Community composition / abundance (cells/L) 2. calculated biovolume (um3/L). Protocols for the phytoplankton time-series are described in Eriksen et al (2018), and the annual sample reports for each deployment. Data storage and access is planned to be interoperable with other national and international programs through the IMOS Infrastructure. Station metadata can be found through this resource. Data is available freely via the AODN portal: https://portal.aodn.org.au. As the taxonomic resolution of the data has changed over time, due to continual training, it is important that users refer to the change log tables included in your data download. These will provide information on the validity of the taxa, from what date we have been identifying certain taxa etc. Classification fields may be blank depending on the level to which that taxa has been identified, i.e. if only identified to family, genus and species will be blank.
-
This record describes a set of media items (8 CDs) dating 2002-2009 Titled: Release of Offshore Petroleum Exploration Areas Australia CDs published by the Department of Resources, Energy and Tourism. The CDs have been received from Donna Hayes for archiving by the Data Centre. Data may be accessed via the GA link below.
-
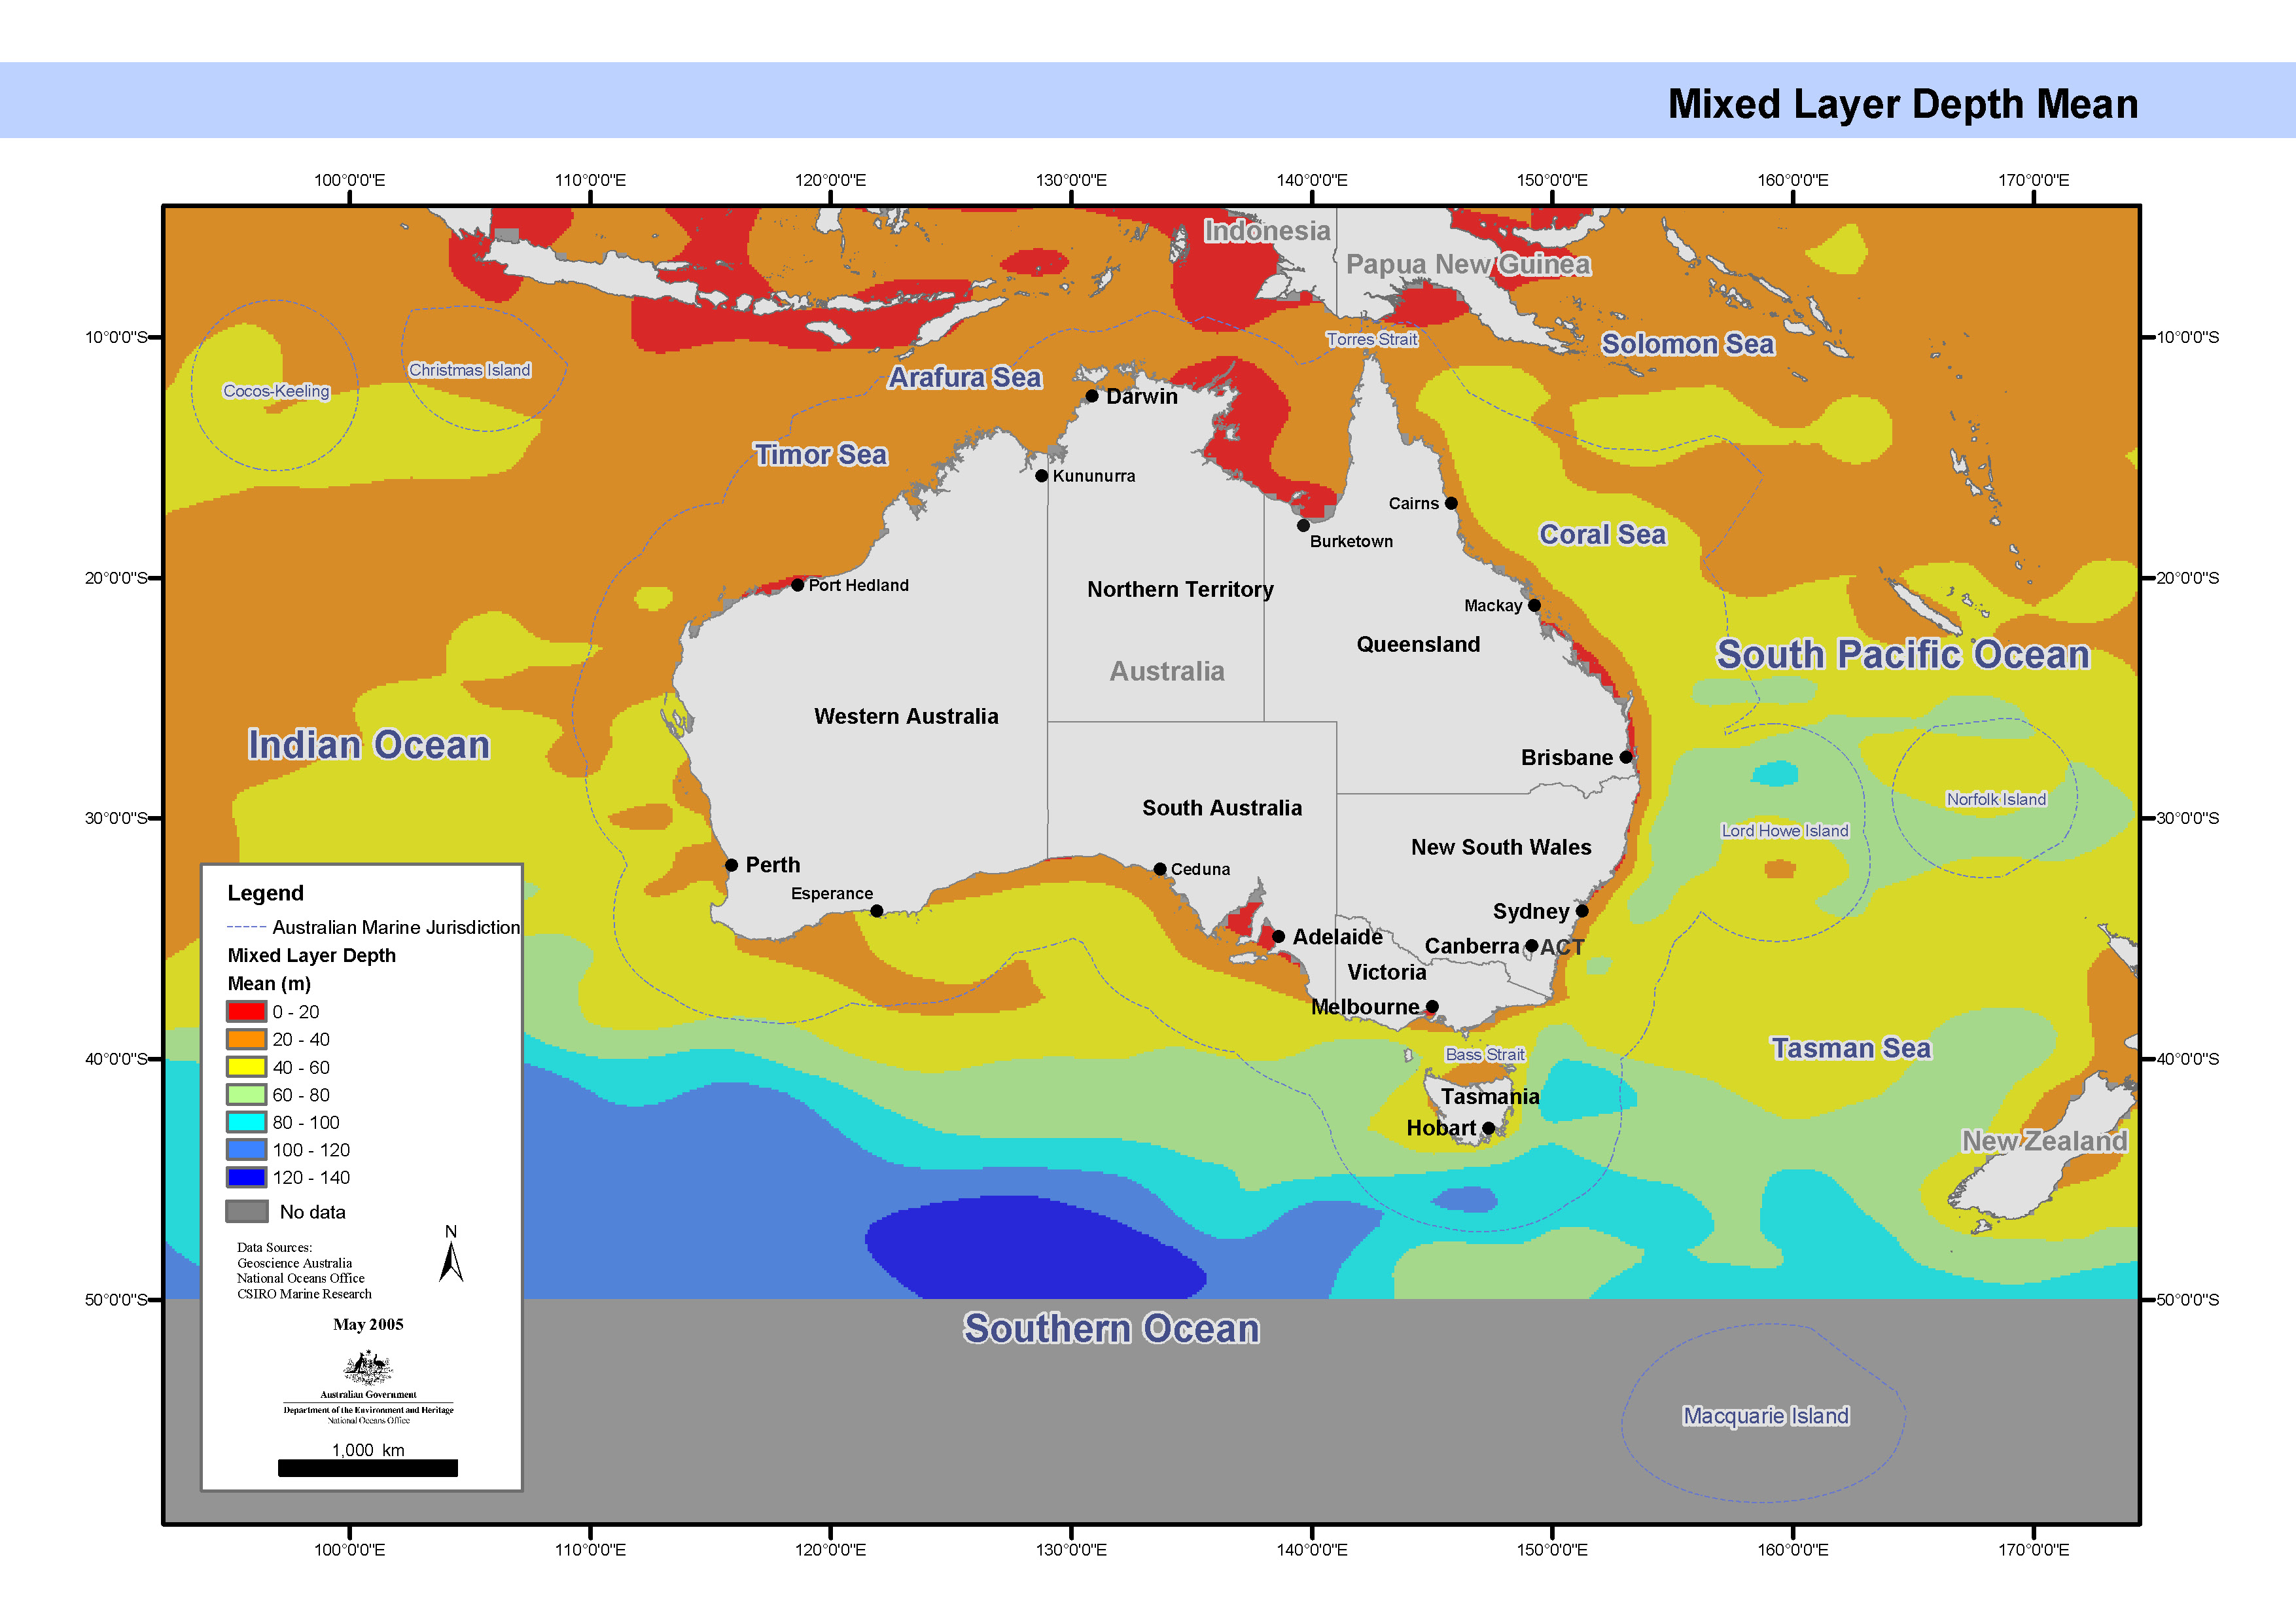
Map showing the ocean mixed layer depth annual mean, calculated from the oceanographic temperature and salinity cast data used to generate CARS2000. This map has been produced by CSIRO for the National Oceans Office, as part of an ongoing commitment to natural resource planning and management through the 'National Marine Bioregionalisation' project. CARS2000 is derived from ocean cast data, which is always measured above the sea floor. However, for properties which do not change rapidly near the sea floor, this would not lead to a significant
-
ESRI grids showing dissolved oxygen, linearly interpolated from CARS2000 mean and seasonal fields to 0.1 degree spaced grid, at depths of 0, 150, 500, 1000 and 2000 metres. The loess filter used to create CARS2000 resolves at each point a mean value and a sinusoid with 1 year period (and in some cases a 6 month period sinusoid - the "semi-annual cycle".) The provided "annual amplitude" is simply the magnitude of that annual sinusoid. CARS is a set of seasonal maps of temperature, salinity, dissolved oxygen, nitrate, phosphate and silicate, generated using Loess mapping from all available oceanographic data in the region. It covers the region 100-200E, 50-0S, on a 0.5 degree grid, and on 56 standard depth levels. Higher resolution versions are also available for the Australian continental shelf. The data was obtained from the World Ocean Atlas 98 and CSIRO Marine and NIWA archives. It was designed to improve on the Levitus WOA98 Atlas, in the Australian region. CARS2000 is derived from ocean cast data, which is always measured above the sea floor. However, for properties which do not change rapidly near the sea floor, this would not lead to a significant error. All the limitations of CARS2000 also apply here.
-
Silicate, linearly interpolated from CARS2000 mean and seasonal fields to 0.1 degree spaced grid, at depths of 0, 150, 500, 1000 and 2000 metres. The loess filter used to create CARS2000 resolves at each point a mean value and a sinusoid with 1 year period (and in some cases a 6 month period sinusoid - the "semi-annual cycle".) The provided "annual amplitude" is simply the magnitude of that annual sinusoid. CARS is a set of seasonal maps of temperature, salinity, dissolved oxygen, nitrate, phosphate and silicate, generated using Loess mapping from all available oceanographic data in the region. It covers the region 100-200E, 50-0S, on a 0.5 degree grid, and on 56 standard depth levels. Higher resolution versions are also available for the Australian continental shelf. The data was obtained from the World Ocean Atlas 98 and CSIRO Marine and NIWA archives. It was designed to improve on the Levitus WOA98 Atlas, in the Australian region. CARS2000 is derived from ocean cast data, which is always measured above the seafloor. However, for properties which do not change rapidly near the seafloor, this would not lead to a significant error. All the limitations of CARS2000 also apply here.
-
ESRI grids showing the ocean Mixed Layer Depth annual amplitude and annual mean, calculated from the oceanographic temperature and salinity cast data used to generate CARS2000. These grids have been produced by CSIRO for the National Oceans Office, as part of an ongoing commitment to natural resource planning and management through the 'National Marine Bioregionalisation' project. CARS2000 is derived from ocean cast data, which is always measured above the seafloor. However, for properties which do not change rapidly near the seafloor, this would not lead to a significant error.
-
This dataset is the wind driven component of transport in the surface boundary is directed perpendicular to wind stress. Negative wind stress curl indicates the winds are placing a clockwise spin on the ocean surface whereas positive wind stress curl indicates the winds are placing a anti-clockwise spin on the ocean surface. (The curl of a field of vectors is a vector which measures the tendency of the vectors to induce rotation.). Wind curl is calculated for the 23 year period from 1976 to 1998 inclusive. Calculated from NCEP Reanalysis data provided by the NOAA-CIRES Climate Diagnostics Center, Boulder, Colorado, USA, from their Web site at http://www.cdc.noaa.gov/
-
CARS2006 spans the southern 2/3 of the worlds oceans, from 70S to 26N, except in the Atlantic where is reaches only to10N. The six water properties mapped in are temperature (deg C), salinity (PSU), oxygen (ml/litre), nitrate (micromole/litre), silicate (micromole/litre), phosphate (micromole/litre). It comprises historic mean fields and average seasonal cycles, derived from all available historical subsurface ocean property measurements (primarily research vessel instrument casts and autonomous profiling buoys). The standard deviation for the nitrate data is used to show the spatial and temporal variation of nitrate in the bottom water utilising all of the historical data for each day of the year. This dataset is a contribution to the CERF Marine Biodiversity Hub.